
The moving average (MA) for a given security is the average value of its price over a certain set time. It can be used to help indicate or dismiss potential trends that may be arising. Following is some information about stock moving averages, and how investors can use them to their advantage.
Moving Averages in Stock Trading
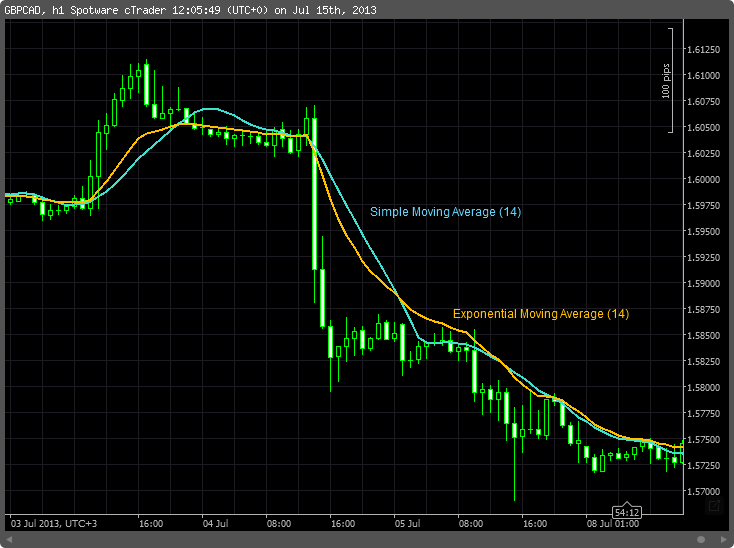
The moving average in stock trading is a security’s average, adjusted over a specified period of time. Generally, shorter length averages, such as an MA (15), the fifteen day average are much more volatile and bouncy than are longer indicators, such as the MA (200). Shown as a line on a graph that is impacted by the values of the security over the specified course of time, the MA can be very helpful in predicting the likelihood that a stock will follow a trend suggested by its recent activity. Often, when stocks rise or fall dramatically, investors can look to the moving average to see whether or not it will likely continue its course, or abandon it, to turn around.
Moving Average and Stock Value
The MAs of given stocks can be very helpful for investors decided their next moves regarding securities that appear to be trending. When a stock moves up or down rapidly and consistently, or experiences gaps, the moving average chart can be very helpful in assisting traders to determine whether the stock will continue its suggested course.
Rising Stock and MA
If a stock consistently moves up over the course of a few days, a medium to long length MA, (50-200) can be used as the deciding factor for an investor about whether or not to sell shares, if owned, or purchase some shares, if they are not in possession; if the security is already trading above its moving average, it can be a good idea to count on its turning around, or evening out, indicating a time to sell what is owned, or hold off on buying. If, however, it is trading below its MA, this can be a time to hold on to shares owned, or to buy some, as it is more likely to continue rising if it is trading below its moving average.
Falling Stock and MA
Conversely, if a stock seems to be consistently falling, its moving average (50-200) can be an indicator for investors monitoring it, helping them to decide whether or not to sell shares in possession, or whether or not to purchase shares. If a stock is trading well above its medium length MA, its falling may actually designate a trend, as it drops back to the norm. This can be a time to sell, and not one to buy. However, if a falling stock is well below its moving average, a sell may be premature, as it can easily turn around and head up, getting closer to its recent average, and a buy may be a better choice for those without shares.
The above scenarios can, however, arise and indicate a stock’s continued rising or falling, regardless of the moving average. If a security continues rising or falling for a few days, it can sometimes prove profitable to do what is unexpected, as the stock may continue its course for longer than expected, before, if ever, turning around.
Conclusion
Although there is never any foolproof indicator that investors may utilize to determine the right actions regarding securities, the moving average can help traders designate or dismiss potential trends, but only at certain times. In fact, if a security consistently trades above or below its average for several days in a row, it can prove to be safe from turning around, and its present impact on the moving average may completely overwhelm the moving average’s implied impact on the stock’s out of place value. Analysis sites such as Stockcharts.com allow users to find valuable information, including moving averages for securities.
By clicking on the click and signing up for an account, I earn a commission, no extra on your part 🙂