
The moving average (MA) in stock trading is a line that shows the average value of a security over a set time period. Short periods have MAs that are generally more up and down and fluctuating (noisier), and longer moving averages are smoother, with less fluctuation (noise). The moving average ribbon in investing is a collection of a number of moving averages, represented on a chart by compiling them all to give a ribbon shape made by averages which differ according to their periods.
Moving Average, a Stock Trading Indicator
The moving average is an indicator that shows the average value of a security. An investor looking at a chart at a site like Stockcharts.com may set the period of the MA, and shorter averages are more impacted by daily trading, whereas longer periods have averages that are more resilient, and are affected more by trends and less by short term fluctuation. For instance, the one day moving average will follow the stock’s values of each day, and the five day average will adjust according to the value over five days as time progresses.
Moving Average Ribbon in Investing
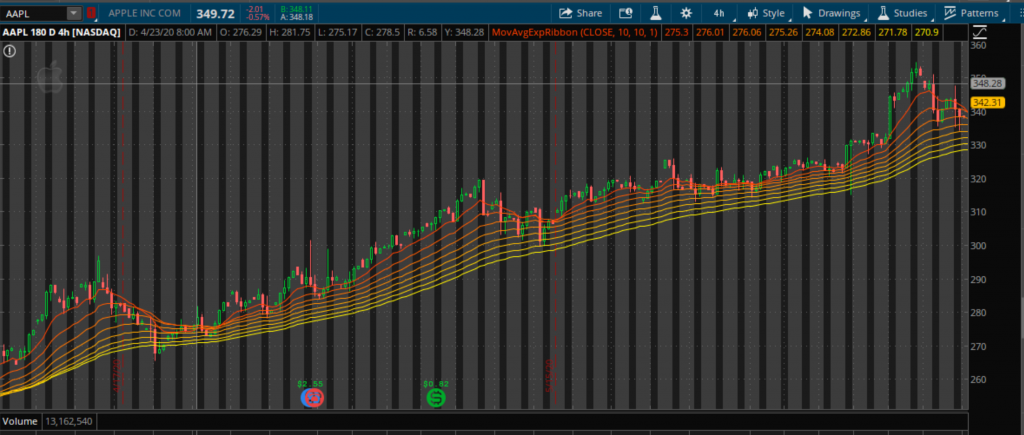
The moving average ribbon is a tool that helps stock traders pinpoint trends. A number of different MAs that vary in duration are placed on a single chart, which then shows many lines, which have the same general course, but each has different specifics based on its period. Bouncier lines are the shorter MAs, which tend to reach closer to the price each day, and more solid, flowing lines are the longer period MAs that make up the ribbon.
The moving average ribbon is made by placing many MAs on one graph. For a good understanding of the short term trending of a security, using a ribbon that uses periods from 10 to 20 days (10 MAs, one for each period) is ideal. However, for a month to month look at trending, using a number of lines that range between 30, and, say, 100 is better.
A new trend is generally signaled for the time period of the ribbon when the longest period MA is crossed by others, which generally act faster. Upward crosses represent new, upward trending and a downward cross shows the beginning of a downward movement.
Conclusion
The moving average ribbon in investing is an excellent indicator tool for finding a stock’s course. It also helps to indicate a security’s volatility: referring to the MA ribbon will show the basic course of the security in the longest period MA, but the shorter ones will also reveal how its value tends to fluctuate over shorter periods of time. This can give stock traders of all levels insight to the current overall course of a stock over the period determined by the moving averages used in the ribbon.
By clicking on the click and signing up for an account, I earn a commission, no extra on your part 🙂