
Pick stocks like the pro’s! Make millions! Jump on the 1,000% gain train!
Yes, you can do all this, and more! Just send $19,999,999,999.95 to me, and I’ll rush your money-making kit out right away….
Don’t Believe the Hype
Sorry, it couldn’t be helped. Guess I just wanted to see, if only for a moment, what it felt like to be a hypester. In truth, it was kinda sleazy. It must be for a select few.
As for me, I’ll go the route of trying to give useful advice for free. I won’t pick stocks for you, but if I can help you make good decisions, that’ll be even more satisfying. Remember: give a man a fish and feed him for a day. Teach a man to fish and feed him for a lifetime. (deep, I know!)
Origin of the Cup with Handle
Those of you who frequent the site (all two of you), whether it be the boards, chat, the bookstore, have no doubt noticed my recommendations of a book by William J. O’Neill, founder of Investor’s Business Daily.
A portion of his CANSLIM model involves chart reading, and his favorite chart pattern is what he calls the cup with handle.
The Cup
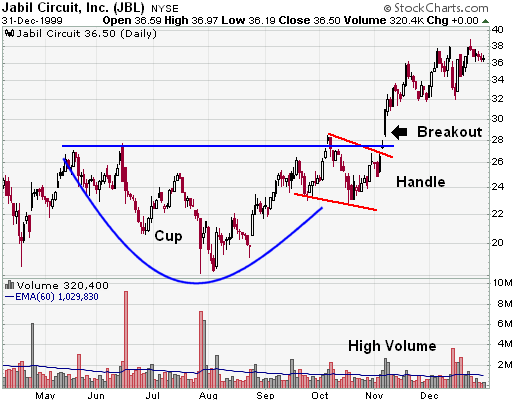
The first part of any chart pattern based on breakouts is a good, solid base. Here, it is referred to as the cup. Take a look.
The cup is formed by the high in Oct and the ‘unsuccessful’ retest of the high in November. Some points to keep in mind about cups:
Length
Generally, the longer the cup, the better. The more time spent basing, the more weak longs are taken out. As the stock makes its climb from the lows the stronger longs take control. The breakout from a long, established base often will be more powerful than one from a shorter, weaker base and should lead to a longer, more sustained rally.
Depth
Ideally a cup should not be too deep. While this is a deep cup it is in no way a negative development. A shallower base just signifies there are stronger longs holding the stock. Once the sellers are done the stock should move higher.
Retest
Keep in mind the retest doesn’t have to touch or come within a few ticks of the old high. But, the further the top of the handle is from the highs, the more significant the breakout needs to be.
Conversely, it can actually surpass it, as it did ever so slightly in the example above. A new high may be made, after which the stock enters a sideways consolidation period.
And, what if, instead of forming the handle in the chart, it ran straight up to before forming a handle? It would be risky to buy on the breakout as the stock hasn’t rested. But if it then goes sideways for a while, a breakout to a new high often leads to a sustained move up.
Volume
Volume should dry up on the decline and remain lower than average in the base of the bowl. And it should increase when the stock finally starts to make its move back up to test the old high.
The Handle
The handle is formed after an ‘unsuccessful’ test of the old highs. I say unsuccessful in quotes as it may actually break the old highs, as in the case of the ‘high handle.’
The points to keep in mind with cups are also valid with handles:
Length
At a minimum, the handle should be four weeks long. Six to ten weeks is ideal, and longer periods are just fine. As with the cup, more time basing shakes out weak longs. The breakout from a long, established base often will be more powerful than one from a shorter, weaker base.
Depth
Ideally, the handle should be very shallow. In my view it shouldn’t be, at most, more than half the depth of the cup. Just as with the cup, the shallower, the better.
Volume
In the best case scenario volume should decline on the drop and start to increase as prices go back up towards the high.
The Breakout
I’ll assume it’s a given the breakout makes a new high. Just in case it’s not though, let me say it: the breakout should make a new high. Closing highs can actually be used in place of actual highs as some long tails may not be representative of the true resistance in the stock.
Volume
As with many charting patterns, volume is often the key. Low volume moves tend to be unreliable as trading could have been influenced by one or a few large trades on a thin day.
A volume surge, however, shows major interest in the stock. On large volume days it is highly unlikely the price could be affected by a small number of players. Therefore, a breakout on heavier than usual volume is much more reliable than a breakout without the confirmation of volume.
How much volume is significant? 50% more than the 50 day average volume is looked for at a minimum while ideally you’d like to see 100% or more.
Measurement of the Potential Move
The primary measurement tool is the depth of the cup. Either the actual point value or a percentage value can be used.
On a point value basis, a move from 8 to 17 equates to 9 points. 9 points added to 17 equates to a target of 26.
On a percentage basis, a move from 8 to 17 corresponds to a move of 112 1/2%. This gives a target of 36 1/8.
The Result
Either target price was met quite easily. In fact, both targets were rather inadequate. But this isn’t always the case. Sometimes they can be spot on, and in other instances they can even be too high. But, more often than not, the measuring criteria give an excellent, high probability, short term target. And this is what the trader is interested in: high probability.
While it is true a cup with handle breakout will usually lead to far greater gains, that would be then taking us into the realm of an investment. Since we’re only talking trading here, the price target calculation does an excellent job.
Finally, not ALL cups with handles lead to successful trades. As with anything in life, there are no guarantees. But swinging the odds in your favor will lead to triumph over the long haul.