Definition of the MACD Stock Technical Analysis Trend Indicator
The MACD stock trading method was developed in the 1960s by Gerald Appel and became popular with online trading platforms. The MACD trading strategy has enjoyed great popularity as a technical analysis tool. In July 2008’s Technical Analysis of Stocks & Commodities, George Siligardos’s article “Leader of the MACD” implies the MACD has been superceded by more sophisticated analyses. Regardless, the MACD is still a commonly used technical analysis component of the best online stock market trading software.
Purpose of the MACD
When the MACD for a stock is positive, its long-term price is trending bullish. If the MACD is negative, the long-term outlook is bearish. When the MACD crosses its signal line, the trend momentum is changing.
Characteristics of MACD
The MACD is:
- A lagging trend deviation indicator using two EMAs as method of deviation.
- Best when used as a technical indicator for long-term trends.
- Plots with stock trading software as a smooth series, ignoring insignificant price variation.
- Subject to whipsaw, often leading to poor market timing.
Definition of the MACD
The moving average convergence/divergence (MACD) is a long-term trend momentum indicator. The MACD is a lagging indicator, describing past price behavior, therefore it has fallen out of favor with many stock market analysts. For a stock market day trader, the MACD is of limited usefulness. There are many other indicators better suited for predicting short-term performance.
The MACD measures trend deviation by calculating the difference between two exponential moving averages (EMAs) by subtracting the shorter term MA from the longer term MA. The individual plots of these two exponential moving averages are continually converging and diverging. The two moving averages used in the MACD are calculated exponentially, meaning more recent price data carries more weight than more distant data.
Calculation of the MACD
There are many possible parameter settings for MACD calculation, depending on whether your timeframe of interest is daily, weekly, or monthly. For example, when working with a monthly chart, you can calculate the MACD of a stock by subtracting the closing price’s 26 period exponential moving average (EMA) from its 12 period EMA. This can be expressed as the formula:
MACD=EMA (12)-EMA (26)
An appropriate MACD signal line in this scenario is the plot of EMA (9).
Your stock charting software can calculate EMAs and plot the MACD for you, but be sure the default settings are relevant and modify if necessary. The relevant period interval may be in months, weeks, days, hours, or even minutes. For example, calculate MACD with daily intervals for a monthly or yearly chart, but with minute intervals for intraday charts.
MACD Indicator Signals
Three major signals exist to trade the MACD indicator:
- When MACD is divergent from price
- When MACD crosses above or below 0
- When MACD line has crossovers with short term signal line
Positive or Negative Divergence
Positive divergence is when the stock price is trending lower but the MACD line is rising higher. Negative divergence occurs when the stock price is moving upwards but the MACD line is falling down. What does this indicate?
The Moving Average Convergence Divergence indicator is a relative tool. Imagine that stock prices drop sharply, but then trades with less volatility as the share value meanders sideways. The stock price has not went upwards in absolute terms. In a relative sense, the short term average has risen when compared to the long range average as the nasty price drop decelerates. The MACD will interpret this as a line moving upwards. This discrepancy is termed positive divergence as the moving average tool shows that the downward trend is slowing (depicted by the indicator turning up) as share price is still slowly dropping. The MACD goes up while the price moves down.
Many traders will purchase a stock when the trend has sufficiently slowed and there is a reasonable expectation that the trend may even reverse into a new one. Other tools and signals are necessary since divergence may occur over very long periods without precise entry signals.
Crossing Above or Below the 0 Mark
When the stock price moves up and down, the moving averages will often cross each other. When the 12 day moving average and the 26 day moving average touch or crossover each other, a signal is generated. On the MACD this signal is expressed by the Moving Average Convergence Divergence line rising above or falling below the 0 reference. The ‘zero mark’ infers that the two moving averages are equal in value at that point in time.
This is considered by many to be a weak signal and traders typically use it with other technical analysis tools.
MACD Signal Line Crossover
The trend-following tool will also cross over the 9 period moving average. This is used as a short term trigger to notify traders when to buy and sell using the MACD.
When the MACD shoots above the 9 period moving average a buy signal occurs. When it falls below the short term moving average a bearish signal is implied. This type of crossover occurs very frequently. Most traders will use this strategy with other confirming indicators.
Using the Moving Average Convergence Divergence Indicator
This technical analysis indicator can be quite powerful in the right hands. Although there are three main methods to suggest entries and exits with this tool, most investors will combine other signals for increased accuracy and precision. Still, the MACD is a staple indicator to learn and generate signals from.
Predicting Trend Direction Changes
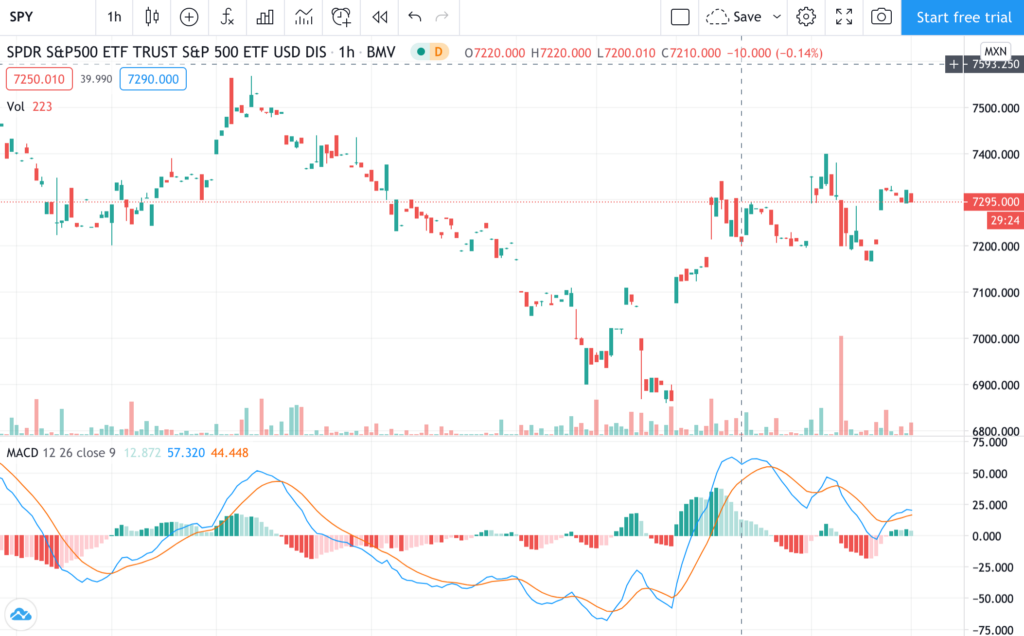
The MACD is used in conjunction with its signal line, often a 9-period EMA of the MACD, in histogram form to anticipate changes in trend direction. When the MACD crosses the signal from above, a short signal is triggered. When it crosses its signal from below, a long signal is generated.
The MACD can exhibit whipsaw behavior. Whipsaw behavior is when an indicator approaches or crosses its signal line suggesting a change in trend direction, but then reverses, essentially yielding a false positive signal for market timing decisions.
To prevent either MACD indifference or response to false entry and exit points, skilled stock traders combine the MACD with other stock market technical analysis indicators. These stock trading strategies may include short-term trend indicators, but if your investment outlook is long-term such indicators may provide trend noise irrelevant to your investment timeframe.
Modifying the MACD for Day-Trading
Martin J. Pring states in Technical Analysis Explained (2002) that most daily stock charts plot MACD with defaults of EMA (26)/EMA (12) with a 9-day signal EMA when in reality these parameters are better suited to a monthly chart. These system settings minimize whipsaw crossovers while preserving the primary trend over this timeframe.
Compare this to the MACD advice from Signalert’s Gerald Appel, referenced in Pring’s Technical Analysis Explained. Appel recommends buy signals on a daily chart should stem from a MACD constructed from EMA (8)/EMA (17) with a 9 period signal. Appel reserves sell signals produced by a MACD of 12,25, and 9 period combinations.
According to Pring, set your technical analysis software to calculate MACD from EMA (65)/EMA (90)with a 12-minute period signal for best performance on hourly charts. This stock trading system will improve signal relevance.