PSAR stands for Parabolic Stop and Reverse and is also referred to as the Parabolic SAR. Developed by technical analyst J. Welles Wilder, this tool provides timely suggestions to buy and sell stocks. How can this indicator be used for profit?
Some Theory Behind PSAR
J. Welles Wilder developed this tool to capitalize on trending stocks. A stock is said to be in a trend when making higher highs or lower lows. According to Stockcharts, J. Welles Wilder estimated stocks to be trending only 30% of the time. If this is taken as true, then the PSAR will not provide accurate signals 70% of the time.
Trend theory analyst and inventor of CAN SLIM, William J. O’Neil, asserts that caution should be exercised when a trend has been established for a lengthy period of time. Stocks will often trade in cycles of trend followed by consolidation. After three or four minor consolidation or basing periods the stock is more susceptible to a reversal. This theory is found at his Investors.com website under the education category heading.
The PSAR tool may look like a simple trailing stop loss, but it is much more. The Parabolic SAR indicator also factors in the ‘weakening trend over time’ theory by tightening the stop loss with each succeeding price bar. While it can provide both entry and exit signals, many technical analysts feel its strength lies in providing dynamic trailing stop loss suggestions.
Reading the Parabolic SAR
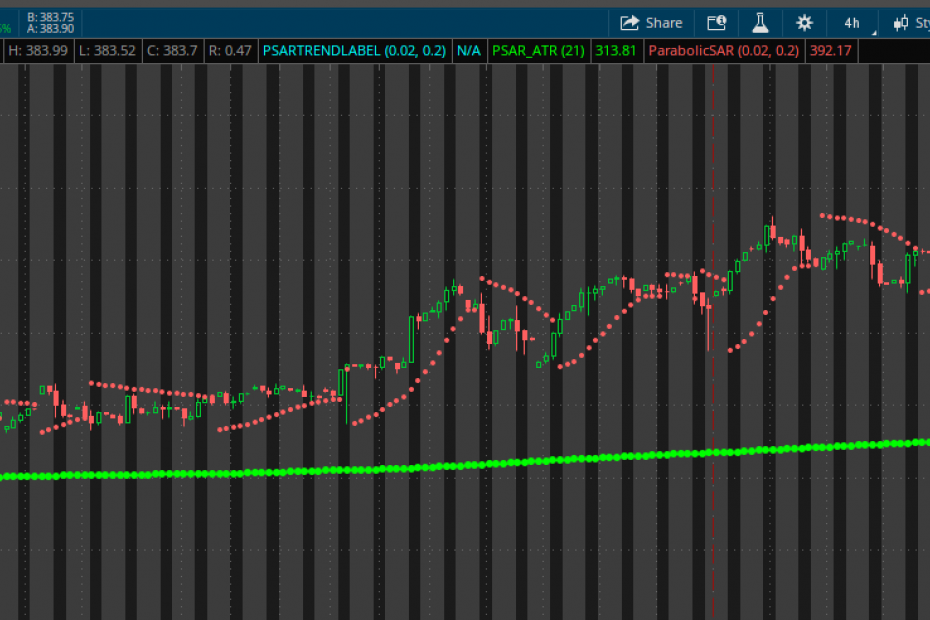
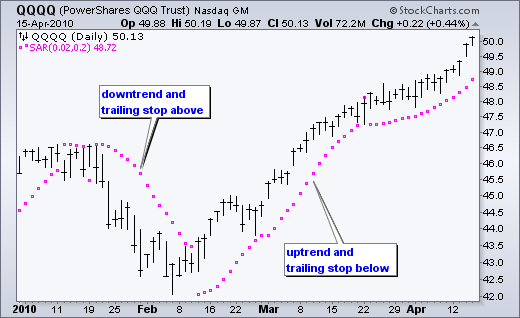
Casey Murphy gives an well rounded report of this tool in the Investopedia article, Introduction to the Parabolic SAR. The PSAR looks like dots above and below the stock price. When the dots are above the share price, the assumption is that the trader is short on the stock. When the dots are underneath the share price the investor is assumed to be long on the stock.
A simple way to trade the PSAR is as follows:
- As soon as the dots appear above the share price, go short
- Stay invested until the upper side dots intersect with share price
- As soon as the dots appear below the share price, trade long
- Stay invested until the PSAR dots below the price intersect
Of course this overly simplistic investment technique will only work 30% of the time according to the creator J. Welles Wilder. How can this system be modified to increase profitability?
Defining a Stock Trend
First, define when a stock begins a trend. This can be achieved through numerous technical indicators:
- Moving Averages (MA)
- Moving Average Convergence Divergence (MACD)
- Average Directional Index (ADX)
- Directional Movement Index (DMI)
- Slow Stochastics
The trend can then be verified by using volume based indicators such as the Money Flow Index (MFI) and the On Balance Volume (OBV). These should be traded together in a harmonious stock trading strategy.
If a stock trading system utilizes various techniques to determine trend instead of relying on the PSAR, then accuracy and profitability should greatly increase. Using the Parabolic SAR just for profitable exits, or as a trailing stop loss, would remove the liability of this tool in trendless or whipsawed markets.
Customizing the Parabolic SAR for Exits
After entering into a trade based on technical indicators that forecast price trend, the investor can then carefully watch the Parabolic SAR for an exit signal similar to a trailing stop loss. The settings are usually set at (0.02,0.2). This is an average setting that may last weeks to months when using it in conjunction with daily price bars.
If an investor wishes to have looser standards to allow for longer consolidation periods then he should adjust the settings slightly and view the output. The two inputs according to Stockcharts are:
- Step
- Maximum Step
Step refers to the acceleration factor over time. As the trend continues, even if it trades sideways, the PSAR tool will tighten. The maximum step dictates how far the PSAR can jump at one time when the stock price rises quickly.
If the investor wishes to slow the tightening effect of the stop loss as time marches on, then the first setting of 0.02 should be lowered. Some use 0.01 as a slower setting. A short term trader (perhaps a day trader with 1 or 5 minute bars), even a swing trader can increase this number slightly.
If the trader wishes the PSAR tool to be more sensitive to the daily price movements (instead of time), then the second setting should be raised in value. Both of these settings will take time and experimentation to customize. Many find the pre-formatted settings to be suitable for average trading.
The Parabolic Stop and Reverse Trailing Stop Loss
J. Welles Wilder produced many valuable technical analysis indicators for determining trend, trend strength and price reversal. The PSAR is one such tool that many traders use as a trailing stop loss.