Trend following tools are primarily used to determine when new trends begin and the dynamic strength of the price pattern. The Directional Movement Index or DMI is one such indicator that has the ability to generate timely signals.
Basic Usage of the Directional Movement Index (DMI)
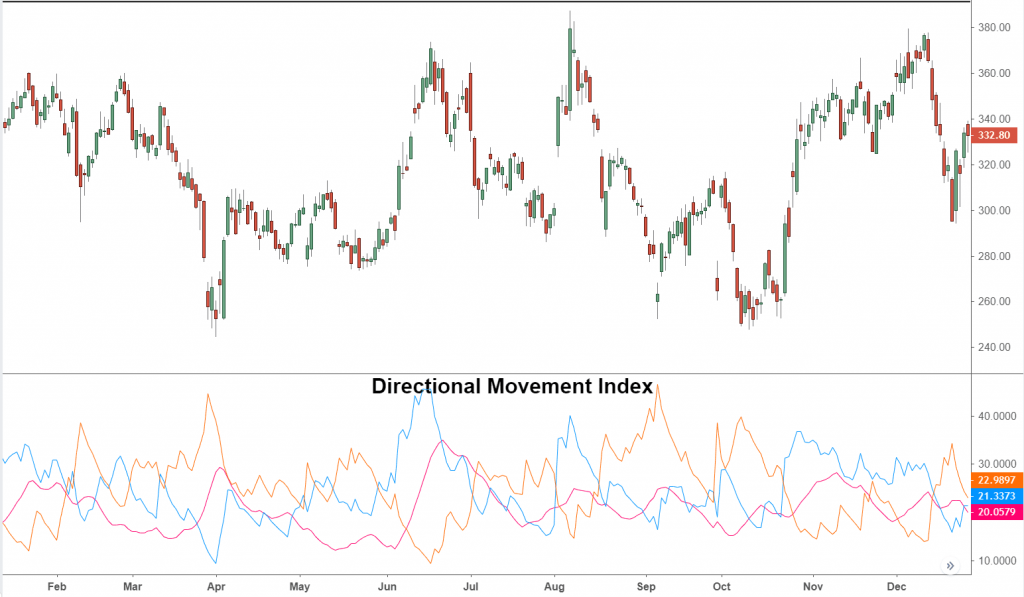
J. Welles Wilder is the technical analyst who created this price derivative formula for trends. The most basic method to trade using the DMI indicators is with crossovers.
- +DI crossing above the –DI indicator is bullish
- -DI indicator crossing above the +DI indicator is bearish.
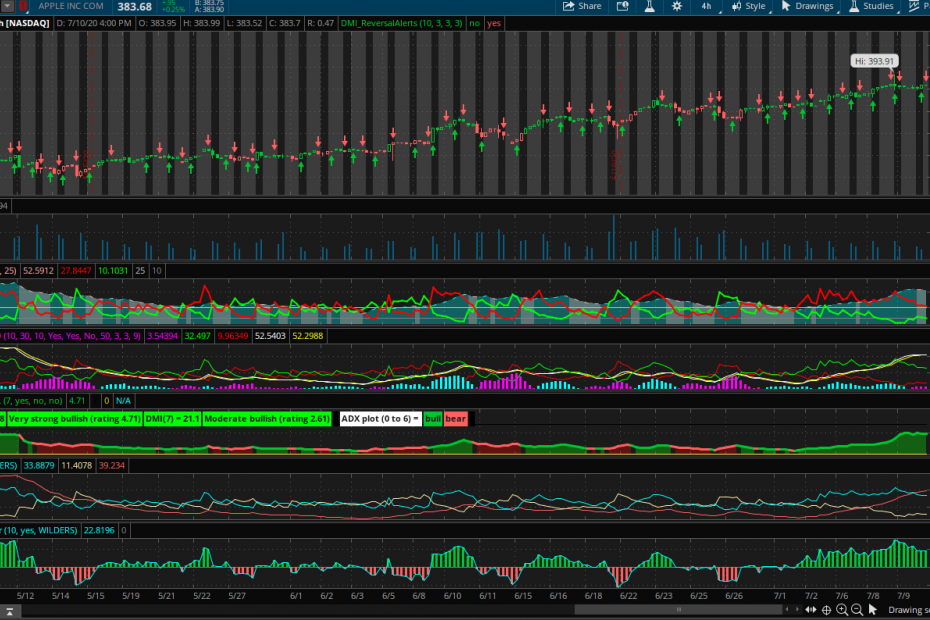
In Stockcharts the colors are green and red of the respective DMI indicators. When green crosses above red, a bullish buy signal is given. When red rises above green a bear signal to sell or short sell is presented. Many traders will enter a stock long or short based on these indicators.
Trade the New Trend
Another feature of the DMI indicator is the ADX line. The Average Directional Index (ADX) is able to show the technical trader how weak or strong the trend is. If the ADX line is high then a strong trend is present. Buying in the middle of a strong bull trend that is well advanced can prove dangerous. Trending occurs in stages and the longer the trend continues the more likely it is to consolidate.
A simple strategy to ensure that the DMI is not giving entry signals into the late stages of the trend is this:
Only trade DMI crossovers when they occur above the ADX line
If the +DI and –DI cross underneath the ADX line, a strong trend is likely present. In some instances the buying occurs too late in the trend and substantial capital is lost. If the crossover takes place above the ADX line, then the trader may choose to employ the final step of confirming the validity of the signal.
Confirming the DMI Signal
Stock prices whip around wildly in volatile and trendless markets. Trend following tools are less relevant in sideways markets. How can a trader protect himself against profitless crossovers in non-trending markets? He can do so by confirming the signal.
Confirming the signal requires the study of the exact day the DMI lines cross
Imagine an investor is trading a fictitious stock XYZ. On a certain day the green or +DI crosses above the red. This crossover takes place above the ADX line. Should the investor buy stock based on this recommendation?
The investor can confirm the DMI entry signal this way. Take the day of the crossover signal. Look at the price range for that specific day. The investor will take special note of the highest daily price. For a confirmed trend buy signal, the price needs to trade higher than this noted price on the following day. If the price cannot exceed the daily high of the crossover day, this DMI signal remains unconfirmed (see image).
The same is true of when the –DI crosses above the +DI. Because this is a bearish signal the investor will note the lowest daily price. For confirmation, the stock will need to drop below that daily low on the following day of trading.
Trend Following Strategies with DMI
The Directional Movement Index or DMI is the backbone of the ADX indicator. J. Welles Wildermeant for these tools to be used in conjunction.
Many technical trading strategies utilize the DMI and ADX indicators. Investors wanting to buy stock off their 52 week lows may use trends to determine a reversal of price direction. Other traders that purchase stock when they breakout (CAN SLIM as an example) may also use a trend following tool to confirm the move. Since DMI does not factor in volume, other tools may be needed.
The DMI or Directional Movement Index is a versatile technical indicator tool that is used in many stock market trading applications.