J. Welles Wilder is the mastermind behind the Average Directional Index indicator also called the ADX. For years many technical traders have used this tool profitably. How did they do so?
Average Directional Index (ADX) Theory
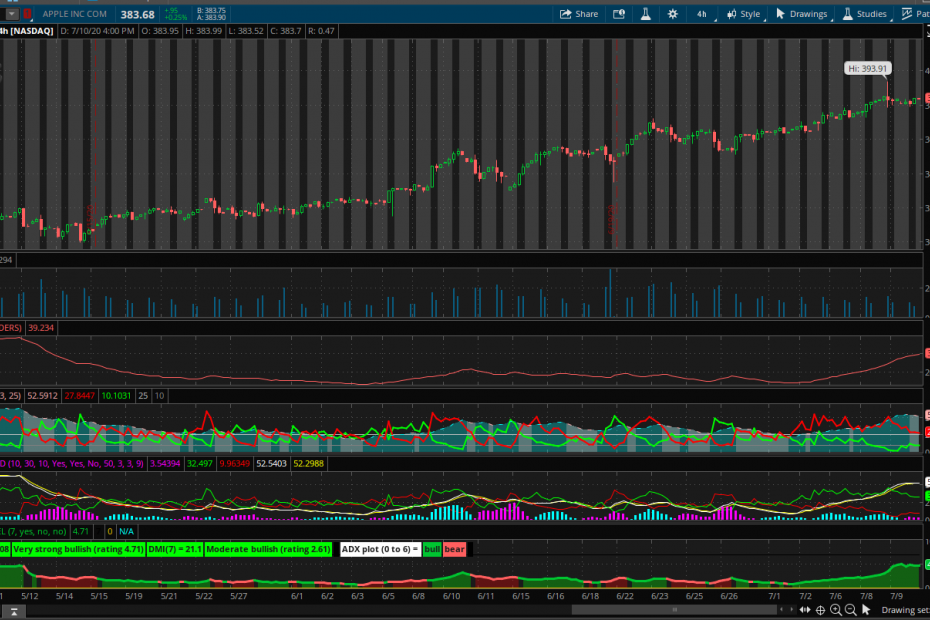
The ADX usually displays two components in the indicator box:
- ADX
- DMI
The DMI stands for the Directional Movement Index. The two components of the DMI actually make up the ADX, but that is for another article topic. The focus will be trading with the ADX.
J. Welles Wilder, a technical trader, believed that stocks usually trade in one direction for a period of time instead of zipping up and down randomly. These prolonged periods of trading in one direction could be labeled as price trends.
Price trends also had many stages or strengths. J. Welles Wilder noted that not all trends were equal. Some would rise bullishly defying all opposing forces while others were weak and whipped about by almost any influence. The ADX was developed to track the strength of such trends.
Defining the Technical Trading Trends
The ADX indicator line is the thick black line in the diagram. Many analysts will infer trend strength in the following manner (variations do exist):
- 0 – 20 = weak or absent trend
- 20 – 40 = moderate trend
- 40 – 60 = strong trend
- 60 – 100 = very strong trend
Keep in mind that the ADX tool does not differentiate between an uptrend and a downtrend. When the indicator implies a very strong trend is in play it could be either. The technical trader will obviously look and determine which direction the trend is moving in.
Length of Trend
Most ADX indicators have the ability to define length of time or period setting. One trader may choose to define the trend using weeks or months worth of data. The standard setting in most applications is 14 periods or days.
Why would a trader want to alter the periods? Very long term trends that last many months or years might be suitable for buy and hold investors. Shorter term trends that utilize 14 days worth of data is often used by swing traders or others who prefer smaller windows of opportunity.
Trading the ADX Trend
Just knowing if a trend is weak or strong does little in the way of generating an entry or exit signal. Although the ADX is most often used with its DMI or Directional Movement Index counterpart, there are some important features to the Average Directional Index.
- ADX moving above the 20 mark. New trends often provide some of the most profitable periods. A new bull or bear market is often punctuated by a sharp move. Traders who know how to jump aboard that trend early on usually receive quick profits. As the ADX moves up past the 20 mark, the technical trading tool is suggesting that a new trend may be starting. With the aid of other indicators, this trend may be confirmed.
- Weakening Trends. After the Average Directional Index has advanced into a moderately strong trend, the danger of a relapse exists. A weakening trend, even as it moves in the desired direction, is a warning signal for the trend follower. Weakening trends can be spotted as the ADX line falls. This is particularly relevant if the trend line is above the 40 mark and then begins to retreat.
As a side note, some investors have found this tool to work well with the William J. O’Neil high growth approach to investing called CAN SLIM.
Is Trend Following for Everyone?
Of course, following the trend is not for all investors uniformly. Some will prefer the short term action of day trading while others will prefer to follow rumor and news. Still, one staple of technical trading will likely continue to be trend analysis. The Average Directional Index or ADX tool provides many valuable indicator signals in this regard.