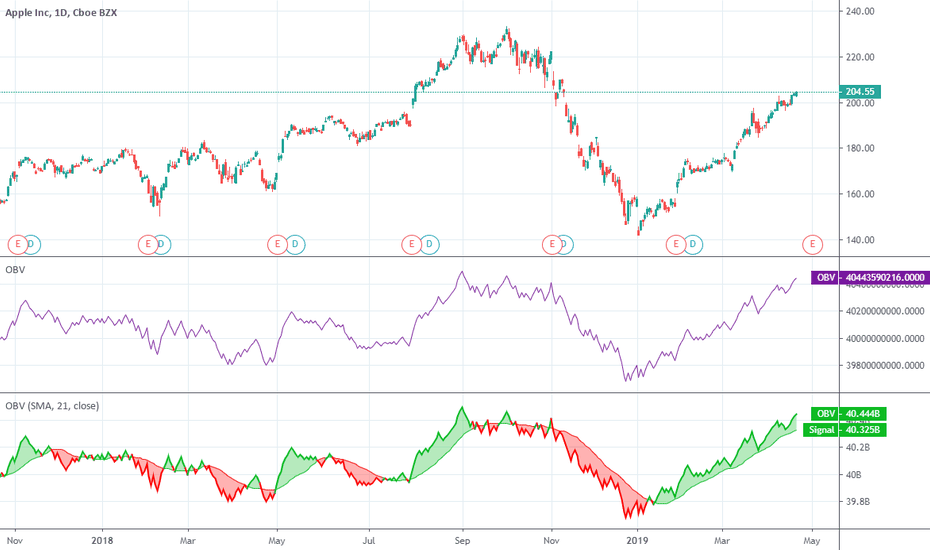
Stock Traders and Option traders may experiment with many volume indicators to quantify buying or selling pressure. Just ‘”eyeballing” the volume bars doesn’t offer enough precision to detect a significant shift in volume flow. The simplest and best volume indicator is on balance volume or OBV. Developed and popularized in 1963 by Joseph Granville, OBV actually produces a curving line on the price chart that either confirms the quality of the current price trend or warns of an impending reversal by divergence.
Looking at the rough chart example below, you can see how much easier it is to follow the volume trend by using the OBV line:
It is simple to construct the OBV line. Each day’s total volume is assigned a + (positive) or – (negative) value according to whether the prices close higher or lower for that day. A higher close generates a plus value, and a lower close, a negative value. Then a cumulative total is maintained by either adding or subtracting each day’s volume.
It is the trend or direction of the OBV line that is important, rather than the actual numbers. The number values are going to differ according to when the trader begins to chart, so his focus should be solely on the on balance volume line.
Ordinarily the OBV line follows the trend direction. In an uptrend the OBV slants up, and it slants down in a downtrend. However, a trader knows when the volume fails to move in the same direction as the prices a divergence exists, and he is looking at a possible trend reversal.
