Technical analysis in stock trading is checking charts and related indicators for price and volume patterns that suggest times to buy or sell stocks. Patterns can form over any time period, including single and multiple periods. One pattern that traders especially look for is the double top.
Characteristics of a Double Top
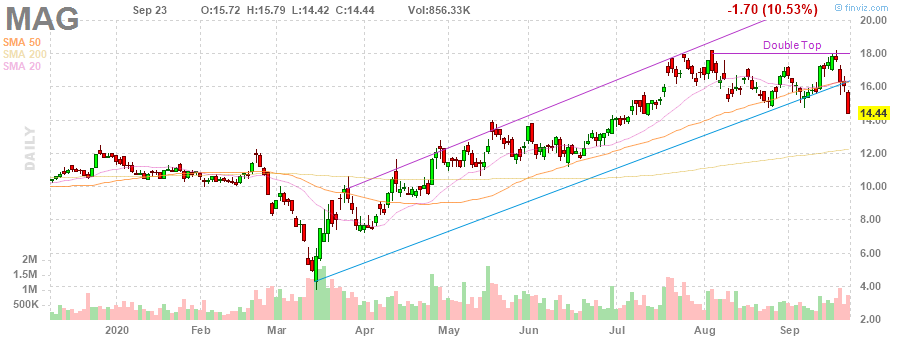
According to Technical Analysis Explained, 4th Edition, by Martin J. Pring, a double top is when a stock (or market) price reaches two peaks at about the same price with a lower price period in between. A typical part of a double top is lower volume on the second peak. See Figure 1, which shows the double top that occurred in the MAG. The chart has prices displayed as daily candlesticks, but unfortunately does not include volume.
What Does a Double Top Signify About Investor Sentiment?
Stock prices that are moving in an upward direction tend to move in that direction until enough investors become convinced that the price is high enough, and the amount of buy orders changes. When a stock price is moving upward, this indicates buy orders exceed sell orders. Once the price gets high enough, fewer buy orders and more sell orders are placed, and the price reverses.
The stock price moves downward until buyers and sellers are once again in balance. The stock stops falling. If buy orders once again accumulate with no change in sell orders, the price moves up again. When it gets to the previous high, a time of decision is before investors. Is the stock worth more, or is it “over-bought”? Was that recent peak an indication that this stock is over-priced? The investor who trades on fundamental analysis will still evaluate the price against some “target” price before placing an order. If the buy orders cannot continue at the same pace, the stock price will fall again.
The reduced volume on the second top is a key indicator. It means that investors have cooled off about this stock. In previous price swings during the rally, there were sufficient buy orders to always drive the price higher after a small pullback. Not anymore. Enough investors have now concluded that the stock is over-priced and hence
- The price does not move above its previous swing high, and
- There are fewer investors who want to buy the stock, as evidenced by reduced volume.
Key Points in a Double Top Formation
The intermediate low, the second high, and the drop below the intermediate low are the key points to look for in the double top. Of course, you won’t be able to recognize a double top is forming until the second top forms and the price drops back to near the intermediate low. Until that happens, the stock or index might just be experiencing another pullback in the uptrend.
Once the double top appears to be forming, look at the volume traded during the second high. If it is the same or higher than the first high, then investors really haven’t signaled that the stock is over-valued or over-bought. Lower volume on second his is a key component of the double top.
Once the stock price falls below the intermediate low, it is likely to continue falling until a point of support is reached. This point is often about the same amount below the intermediate low as that low was below the peaks. That’s not firm, however. Stock prices can obviously drop lower. On occasion, when support points are close together, the drop below the intermediate low might not be that low after all.
A double top is a powerful indicator of a change in investor sentiment. However, as with most things in stock trading it is not foolproof. Stocks can make what appear to be double tops, only to reverse and continue to new highs. Be cautious about trading the double top. Take time to review charts and become familiar with how the market or stock price moves. Be aware of news events, and the overall direction of the market.